Sustainability Reports & Scope 3
ReRoute AI generates sustainability reports that track the environmental impact of your product inventory. These reports are especially useful for ESG (Environmental, Social, and Governance) compliance, corporate sustainability goals, and identifying opportunities to reduce your carbon footprint.
What Scope 3 Emissions Mean
In the GHG Protocol (the most widely used greenhouse gas accounting standard), emissions are divided into three scopes:
- Scope 1 -- Direct emissions from sources you own or control (for example, a gas stove in your kitchen).
- Scope 2 -- Indirect emissions from the electricity and energy you purchase.
- Scope 3 -- Everything else in your value chain. This includes the products you buy, the packaging they come in, transportation from your suppliers, and what happens to products after you dispose of them.
For food service operations, Scope 3 is typically the largest source of emissions -- often 70% or more of your total footprint. That is because the carbon cost of manufacturing, packaging, and shipping the thousands of products you purchase each month far exceeds the energy you use on-site.
ReRoute AI focuses on Scope 3 because it is where your purchasing decisions have the greatest impact. Every time you choose a product with lower packaging emissions or switch to a compostable alternative, you directly reduce your Scope 3 footprint.
How Your Carbon Number Is Calculated
Two things get mentioned together a lot, so it's worth separating them:
- A product's sustainability score (0–100) rates how eco-friendly its packaging and materials are — higher is better. See Understanding Sustainability Scores.
- Your carbon number is an actual emissions quantity, measured in kilograms of CO2 equivalent (kg CO2e). It's what your Scope 3 report totals up. It is not the 0–100 score.
The carbon number is built from your day-to-day activity, one step at a time:
- You act on inventory — receive a delivery, use product, or transfer and waste stock. Each of these is an event the platform records.
- The platform assigns an emission factor to that activity, using the most specific data available and falling back to sensible category defaults. If it can't find a trustworthy factor, it flags the item rather than guessing.
- It calculates the emissions — the activity (such as the quantity received) times the emission factor — and tags it with the correct GHG scope (purchased goods land in Scope 3).
- It records one permanent entry in your carbon ledger — an append-only, tamper-evident log where every kg CO2e can be traced back to the exact event, product, and data source behind it.
- Those entries roll up by property and time period into the totals you see on your dashboard and in this report.
Because the dashboard and the reports both read from the same ledger, the numbers always agree. Recipes add an optional layer on top, attributing a slice of that already-counted carbon to each dish you sell (see Recipes & Per-Dish Carbon) — without adding any new emissions.
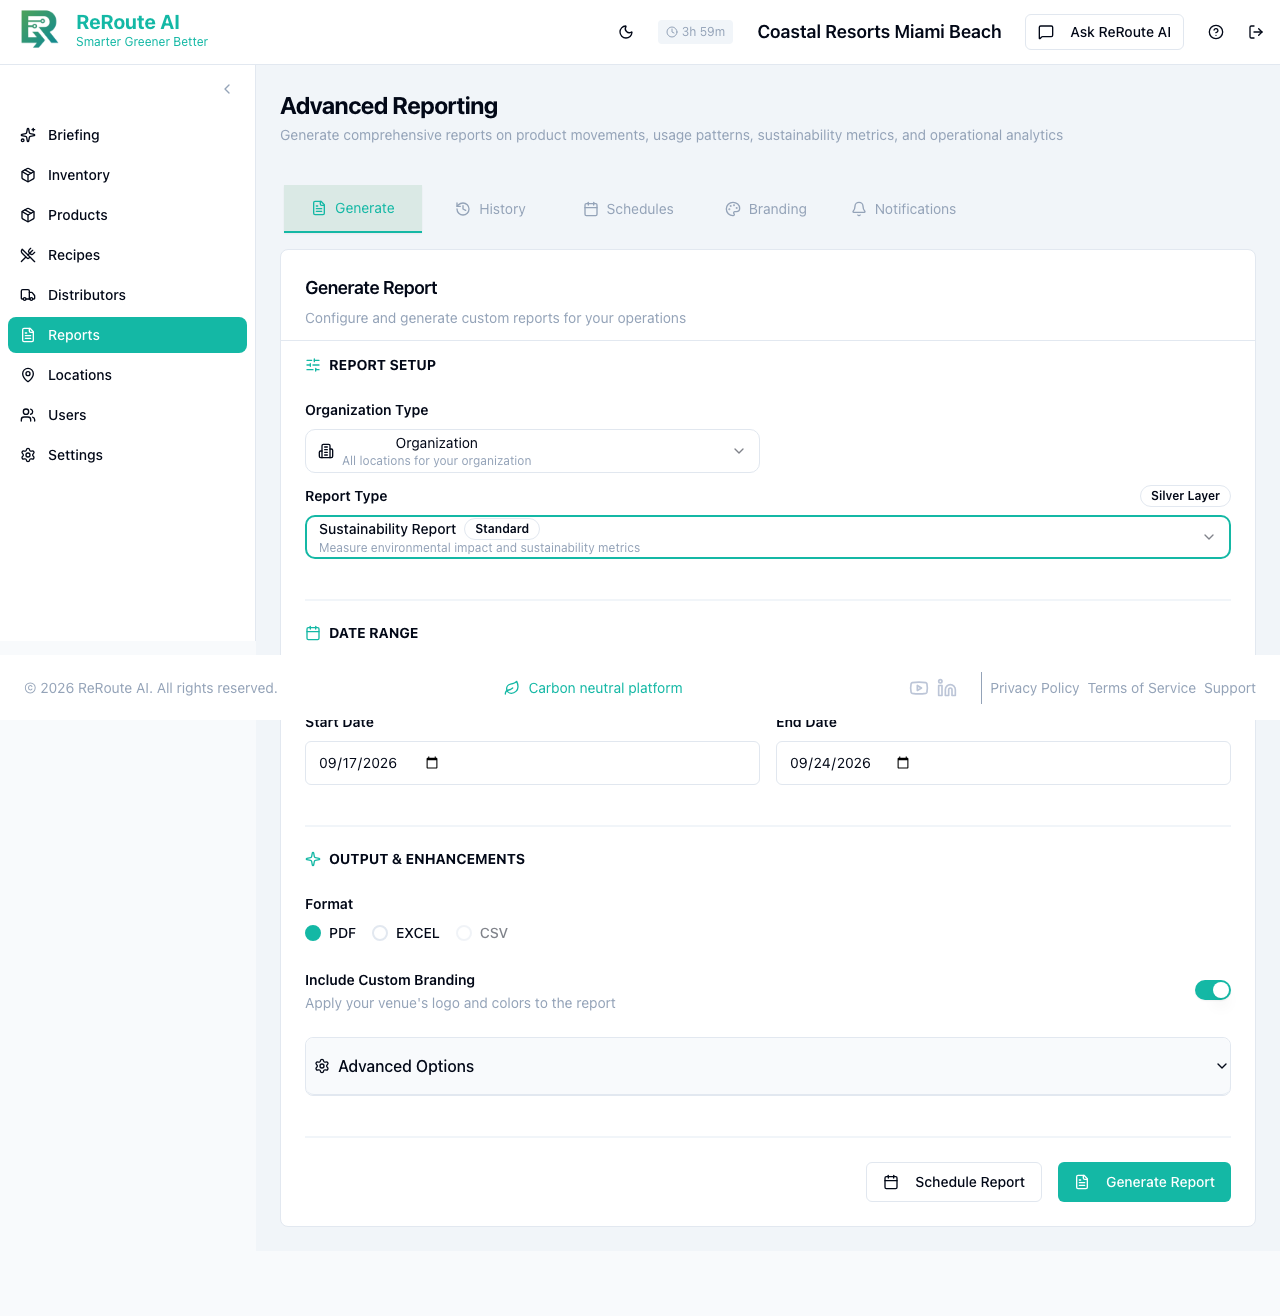
What the Sustainability Report Contains
The sustainability report provides a detailed breakdown of your environmental impact:
- Product-level carbon footprint -- The estimated kg of CO2 equivalent (CO2e) per unit for each product, based on its materials and packaging.
- Total carbon impact -- Your overall emissions across all products, calculated by multiplying per-unit footprint by quantity used.
- Material composition -- What each product is made from and how that affects its score.
- Recyclability scores -- How recyclable or compostable each product is.
- Waste diversion rates -- The percentage of your waste that is recycled or composted rather than sent to landfill.
You can generate reports for specific time periods, individual locations, or across your entire organization.
Report Formats
Reports are available in three formats:
- PDF -- Formatted reports with charts and your company branding, ideal for sharing with stakeholders.
- Excel -- Detailed data in spreadsheet format for your own analysis.
- CSV -- Raw data export for importing into other systems.
Custom Branding
PDF reports automatically include your company branding. The system applies branding in this order:
- Location-specific branding -- If you have set up custom branding for a specific location (for example, a different logo for your downtown property), that branding is used first.
- Organization-level branding -- If no location-specific branding exists, your organization's default branding (logo, colors, fonts) is applied.
- Platform defaults -- If no custom branding is configured at all, the report uses the standard ReRoute AI template.
You can configure your branding from the Reports settings page, including your logo, primary and secondary colors, and font preferences.
Using Reports for ESG Compliance
Many organizations need to report on their environmental impact for regulatory compliance, investor requirements, or sustainability certifications. Here is how ReRoute AI reports help:
- Track progress over time. Generate monthly or quarterly reports to show how your carbon footprint is changing. Look for downward trends as you switch to greener products.
- Identify high-impact products. Sort by total carbon impact to find the products contributing the most to your emissions. These are your best candidates for substitution.
- Document waste diversion. Use the waste diversion rate data to demonstrate compliance with local waste reduction ordinances.
- Support corporate reporting. Export data in CSV format to feed into your organization's broader ESG reporting tools.
Scheduling Automated Reports
You do not have to remember to generate reports manually. Set up a schedule to have them delivered automatically:
- Go to Reports and select Schedules.
- Choose the report type (Sustainability), format, and date range.
- Set the frequency: daily, weekly, or monthly.
- Add recipients (email addresses or phone numbers).
- Save the schedule.
Scheduled reports are generated automatically and delivered to the specified recipients. This is especially useful for sending monthly sustainability summaries to your management team or corporate office without any manual effort.