Demand Forecasting
Demand forecasting helps you predict how much of each product you will need in the coming days and weeks. Instead of guessing based on gut instinct or last week's numbers, the platform analyzes multiple data sources to give you data-driven recommendations.
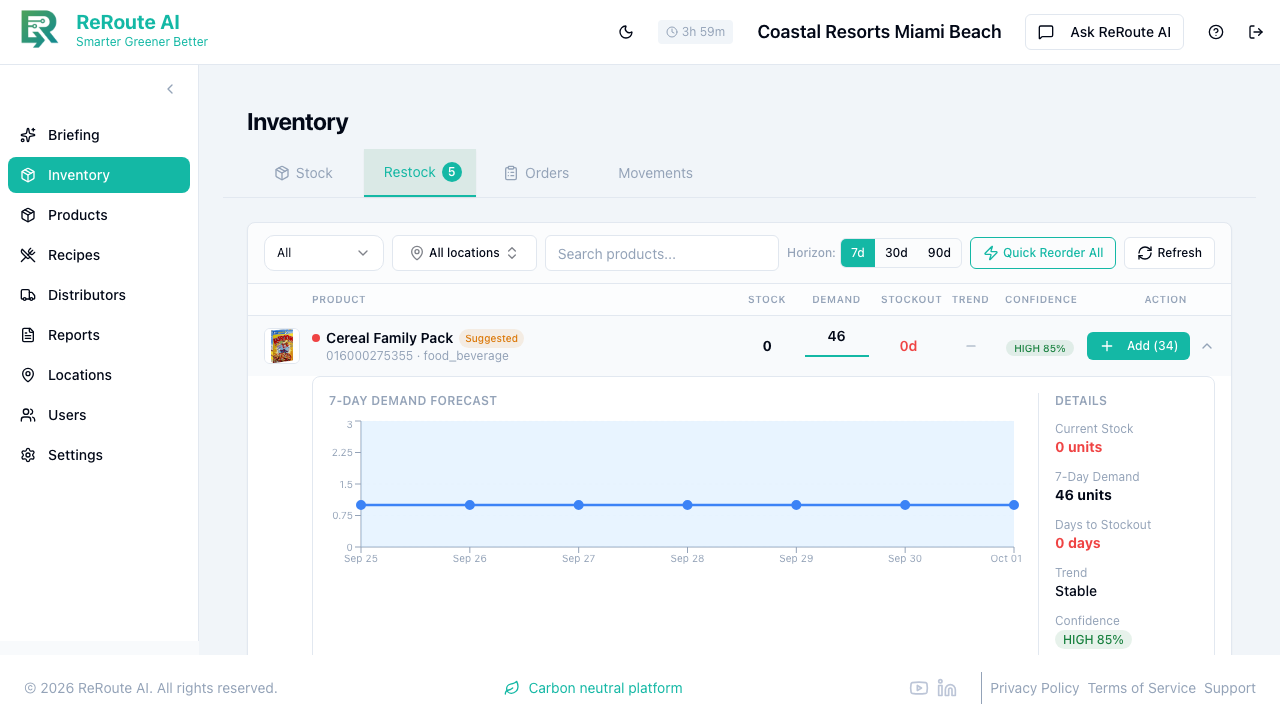
What Demand Forecasting Does
The forecasting system answers your most pressing ordering question: "How much should I order, and when?" It looks at your historical usage patterns alongside external factors to produce daily predictions for up to 14 days out.
For each day in the forecast, you get:
- A predicted quantity -- the system's best estimate of how many units you will use
- A confidence interval -- a range showing the likely minimum and maximum demand
- Key factors -- what is driving the prediction (for example, a local event, weekend patterns, or weather)
How Predictions Work
The forecasting system combines several signals to build its predictions:
Historical patterns
Your past 90 days of usage data reveal strong patterns. The system identifies day-of-week trends (Saturdays might be 1.5 times busier than Tuesdays), seasonal shifts, and overall growth or decline in usage.
Local events
Concerts, sports games, conferences, and other events near your location can dramatically affect demand. The system checks event calendars and estimates how much each event will impact your traffic based on attendance size and proximity.
Weather
Weather conditions influence customer behavior. Sunny weekends at a beachfront restaurant drive higher traffic, while severe storms keep people home. The system pulls 7-day weather forecasts and adjusts predictions accordingly.
Tourism indicators
For hospitality venues, hotel occupancy and pricing in your area signal how many visitors are in town. High hotel rates and occupancy suggest a busy week ahead.
Reading Confidence Intervals
Every forecast includes a confidence range, not just a single number. Understanding this range helps you make better ordering decisions:
- Narrow range (for example, 240--260 units) means demand is predictable. Your historical patterns are consistent, and no unusual factors are expected. You can order close to the predicted amount.
- Wide range (for example, 180--350 units) means demand is variable. This might happen when a large event could bring a surge of customers, or when weather is uncertain. Consider ordering toward the higher end of the range to avoid running out.
The confidence interval gets wider as the forecast extends further into the future. A prediction for tomorrow is more precise than one for two weeks from now.
Par Level Recommendations
Based on the forecast, the system calculates recommended par levels -- the minimum quantity you should keep in stock. These recommendations factor in:
- Your predicted daily demand
- Your supplier's lead time (how long it takes to receive an order)
- A safety buffer to handle unexpected spikes
- Your desired service level (how confident you want to be that you will not run out)
When the system recommends a par level of 162 units with a reorder point, it means you should place an order when your available stock drops to that level to avoid a stockout before the next delivery arrives.
Using Forecasts for Ordering
Here is a practical workflow:
- Check your forecast for the next 7--14 days by asking "What should I order for next week?" on the Briefing page.
- Review high-demand days. Look for spikes caused by events or weekends and make sure you have enough stock to cover them.
- Compare to current inventory. The system shows your current stock alongside predicted demand so you can see exactly how many days of supply you have.
- Place your order with enough lead time. If your supplier needs two days to deliver, order at least two days before you expect to hit your reorder point.
- Monitor actuals vs. predictions. Over time, you will see how accurate the forecasts are for your location, which helps you decide how much buffer to add.
Demand forecasting works best when you have at least 30 days of usage history. The more data the system has, the more accurate its predictions become.